
Please enter a keyword
What is conversion path analysis?
Learn how Conversion Path Analysis tracks the exact sequence of events that converted users took, so you can focus on what actually drives results.
Author: Cascade
Analysis Points
Through this analysis, you can discover the following trends and issues.
• Typical routes taken by converted users
• Behavioral patterns that are likely to lead to conversion
• Routes where users tend to concentrate and points where drop-offs may occur
Using Conversion Path Analysis
We will explain how to set up the analysis and how to read the graphs.
Operating Procedures
1. Set the events to display and conversions
2. Check the graph
3. Review the path in detail
1. Set the events to display and conversions
Set the events to be analyzed and the goal conversions.
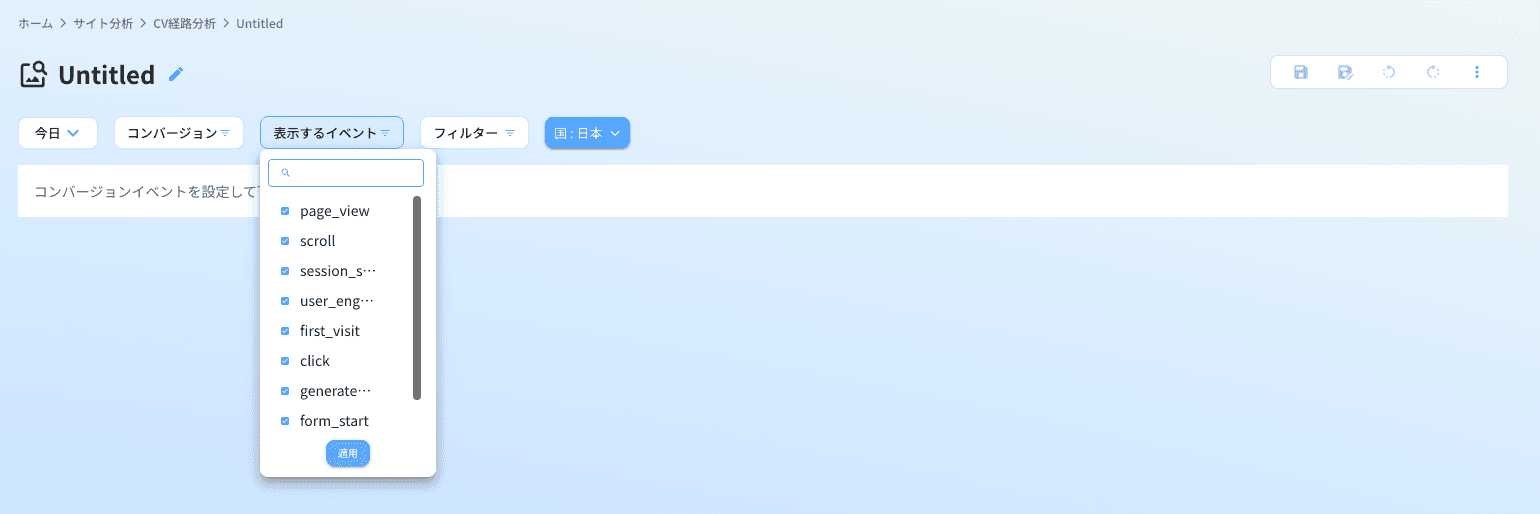
1. In the [Events to Display] tab, select 10 events to use for the analysis. *By default, the 10 events with the most occurrences are automatically selected.
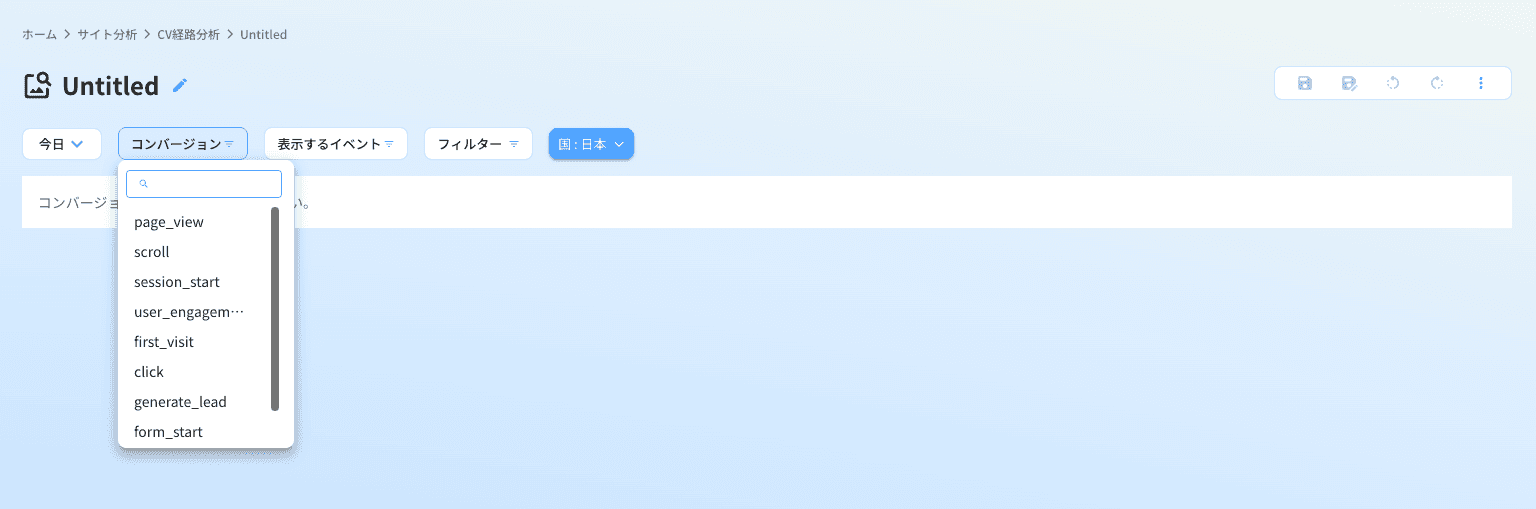
2. In the [Conversions] tab, select the conversion events you want to analyze. *Only the events included in the 10 selected in step 1 can be set for conversion.
2. Check the graph
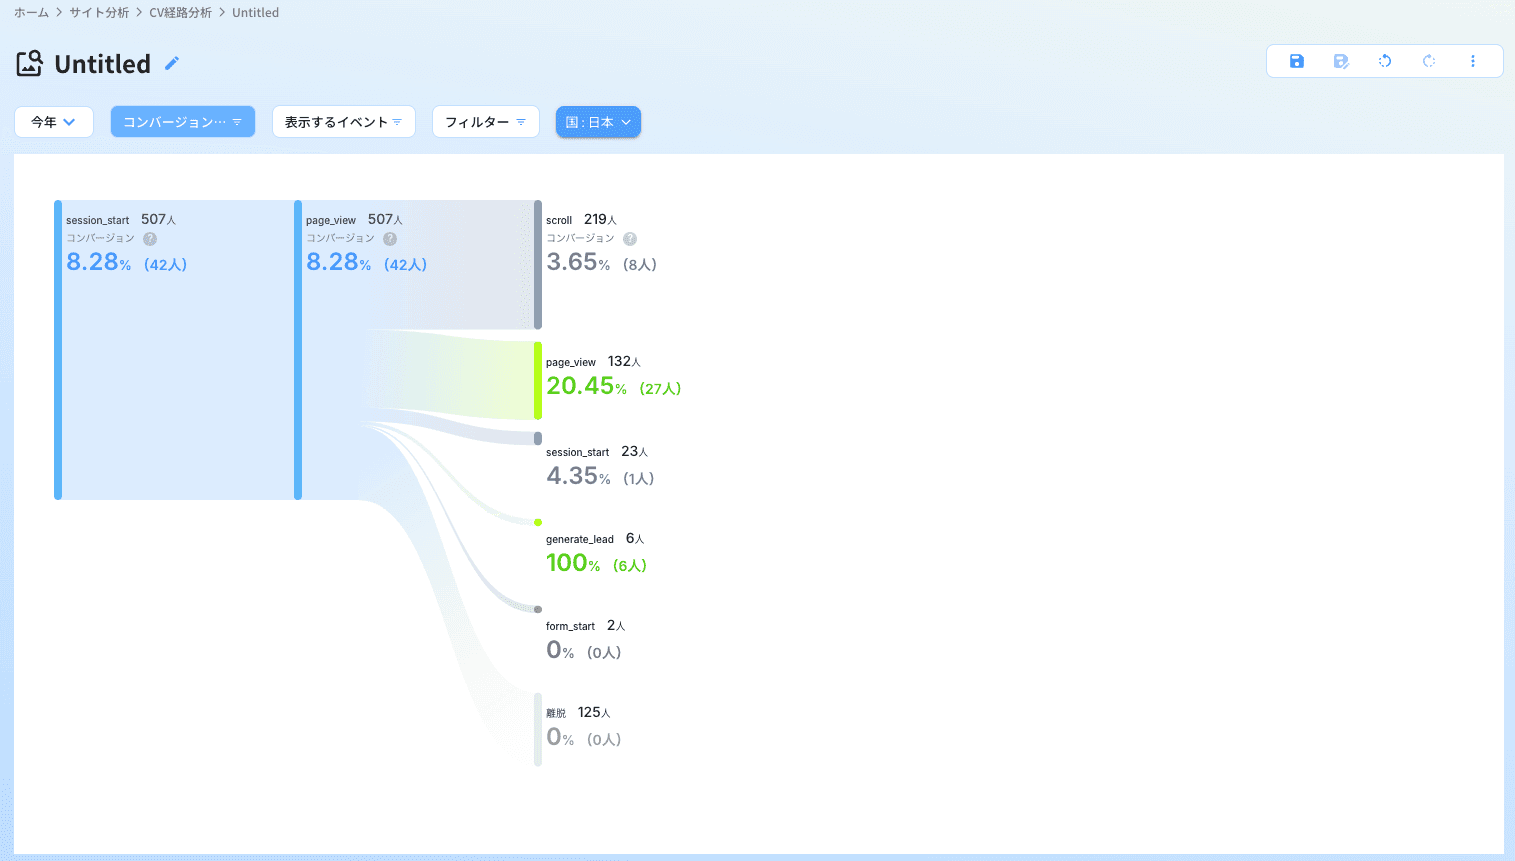
Once the settings are complete, the graph of the conversion path will be displayed. The numbers within the graph represent the following:
• Top number: The total number of users targeted
• Percentage: The proportion of all users that passed through that path
• Number in parentheses: The number of converted users that passed through that path
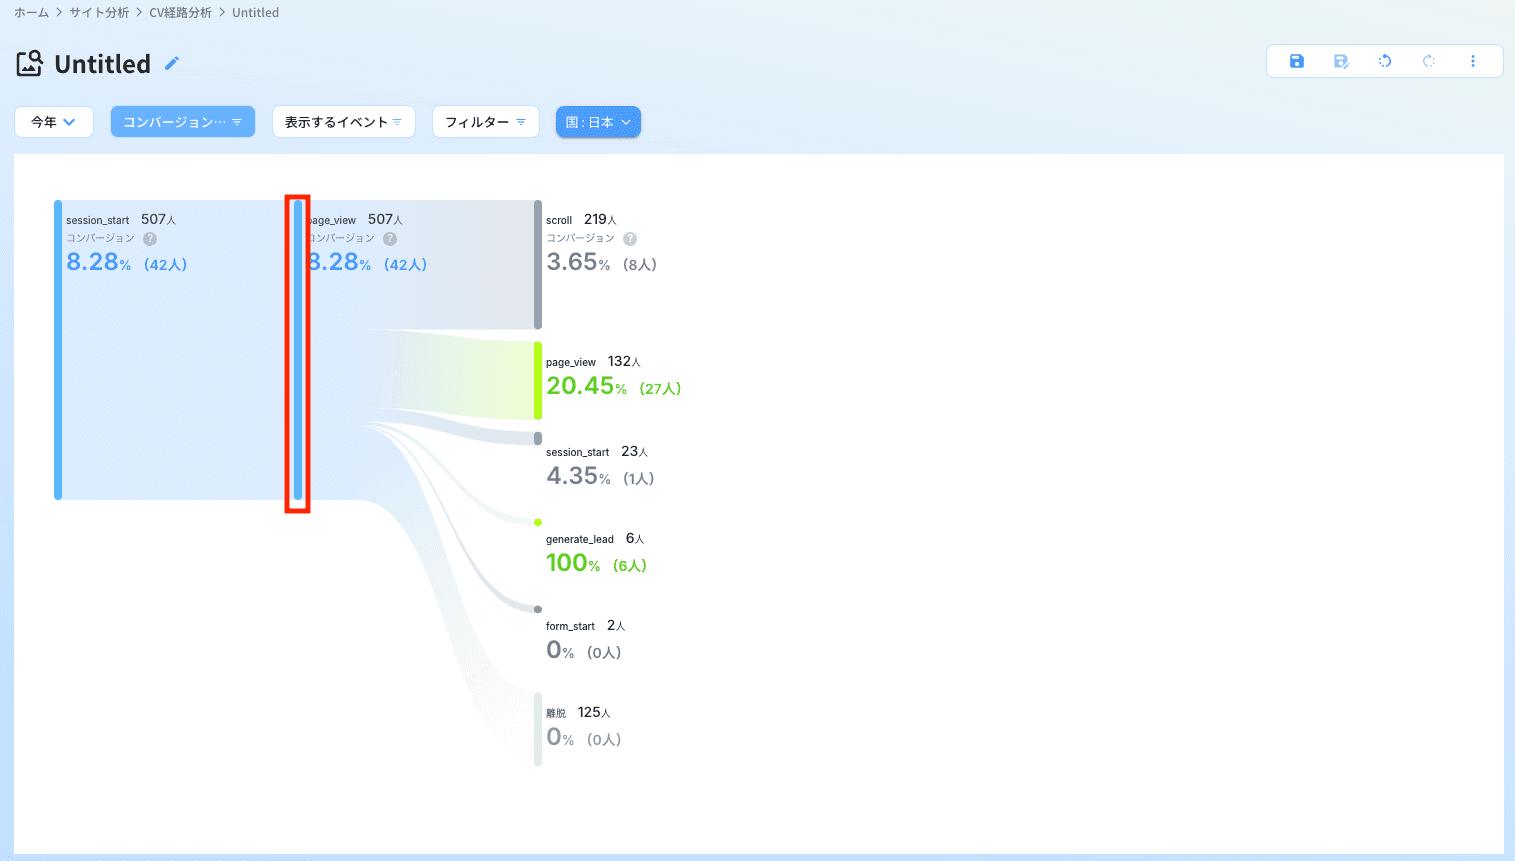
3. Review the path in detail
Clicking on the bars within the graph (elements of the path) will display the subsequent paths. By repeating this operation, you can gradually check where users went next.
Tips for Selecting Events Since the number of events that can be displayed is limited to 10, the way you choose events will impact the analysis results. It is recommended to start the analysis with the "top 10 events with the highest occurrence" initially, and when a hypothesis is formed, to replace them with "events close to conversion" or "important steps" for verification.
Related to
