Funnel Analysis Guide: Tools, Examples, and Playbooks
Funnel Analysis Guide: Tools, Examples, and Playbooks

Are you struggling with a lot of access to your website but not achieving significant results?
The key to visualizing the actions that customers take before purchasing products or applying for services, discovering and improving issues, is "funnel analysis." In 2024, data-driven marketing strategies are becoming increasingly important.
This article thoroughly explains everything from the basics of funnel analysis to practical applications. It includes a comparison of 10 recommended tools, both free and paid, specific analysis methods using GA4, Excel, and Python, as well as industry-specific success stories for e-commerce sites and BtoB SaaS companies, packed with practical know-how you can use starting tomorrow. Please master funnel analysis that leads to increased sales in this article.
Recommended 9 Funnel Analysis Tools! Comprehensive Comparison from Free to Paid
Funnel analysis tools are available with diverse functions and price ranges. Many people may find it difficult to choose which tool to select. Therefore, in this section, we have carefully selected four free tools and five paid tools, comparing their features, pros and cons to support your optimal tool selection.
3 Free Tools: For Those Who Want to Start Analyzing Easily
First, here are three recommended free tools for those who want to start funnel analysis without incurring costs. These tools come with basic functionalities and are attractive for their easy implementation. However, please note that there may be limitations on features and data capacity.
1. Google Analytics 4 (GA4)
GA4 is a free web analytics tool provided by Google. It allows you to analyze website traffic and user behavior in detail, and it can also be used for funnel analysis. By utilizing event tracking features, you can visualize customer behavior within the website, identify drop-off points, and explore improvement measures.
Features | Advantages | Disadvantages |
|---|---|---|
Rich data analysis capabilities, free | Easy to implement, allows diverse data acquisition, widely used on many websites resulting in abundant information | Advanced analysis requires expertise, data interpretation can take time |
2. Google Sheets
Google Sheets is a spreadsheet software that anyone can use easily. For simple funnel analysis, it can handle everything sufficiently just with the spreadsheet. By importing data from GA4 and creating graphs, you can visually understand the funnel.
Features | Advantages | Disadvantages |
|---|---|---|
Ease of use, free | Easy to implement, anyone can operate it, easy to visualize data | Lacks advanced analytical features, not suitable for large-scale data analysis |
3. Simple Analytics
Simple Analytics is a web analytics tool that emphasizes privacy. It anonymizes personal data during analysis, allowing compliance with privacy regulations like GDPR. The free plan has limits on the number of website registrations and data storage periods.
Features | Advantages | Disadvantages |
|---|---|---|
Privacy-focused, simple design | Analysis with a focus on privacy, simple interface | Functionality limitations in the free plan, restrictions on data storage, not available in Japanese |
5 Paid Tools: For Those Who Want Serious Analysis Results
If you need more advanced analysis or large-scale data processing, paid tools are recommended. Paid tools offer advanced features, customization, and comprehensive support, which are not available in free tools. Consider the cost-effectiveness and choose the appropriate tool.
1. Adobe Analytics
Adobe Analytics is the best tool for large-scale data analysis. It has various features such as advanced segmentation and real-time analysis capabilities. It is suitable for analyzing websites or apps of corporate scale.
Features | Advantages | Disadvantages |
|---|---|---|
Advanced analysis features, real-time analysis | Large-scale data processing, high customization | High price, requires expertise |
2. Mixpanel
Mixpanel is a tool specialized in user behavior analysis. It allows detailed tracking of user behavior within apps or websites, analyzing drop-off points and customer behavior patterns.
Features | Advantages | Disadvantages |
|---|---|---|
User behavior analysis, high customization | Detailed understanding of user behavior, effective improvement planning | High price, setup can be complex, not available in Japanese |
3. Kissmetrics
Kissmetrics is a tool that provides detailed tracking of customer behavior to enhance customer lifetime value (LTV). It is helpful for customer segmentation and personalization as well.
Features | Advantages | Disadvantages |
|---|---|---|
Customer behavior analysis, ability to analyze LTV enhancement | Deepening understanding of customers, executing effective marketing measures | High price, requires expertise |
4. Amplitude
Amplitude is a tool that can analyze user behavior for mobile apps and websites. By creating user segments and analyzing the behavior of each segment, you can consider optimal measures tailored to your target demographic.
Features | Advantages | Disadvantages |
|---|---|---|
User segmentation, mobile app analysis | Execution of measures tailored to the target demographic, effective improvement planning | High price, setup can be complex |
5. Cascade
Cascade is an AI-powered platform specialized in advertising analysis and website behavior analysis. It offers tools like advertising budget optimization, funnel analysis, and path analysis, maximizing advertising effectiveness and enabling data-driven decision-making.
Features | Advantages | Disadvantages |
|---|---|---|
AI analysis: Supports optimization of advertising costs, site improvement proposals, and automatic report creation. | Efficiency: Automates report creation and analysis work, significantly reducing time. | Just released, the completeness of features is an issue. |
Tool Comparison Table: Check Functions, Prices, and Features at a Glance
The table compares the 9 types of tools introduced above based on features, prices, and characteristics. Please use it as a reference for selecting the tool that best fits your needs.
Tool Name | Price | Main Functions | Features |
|---|---|---|---|
Google Analytics 4 (GA4) | Free | Website traffic analysis, user behavior analysis, funnel analysis | Easy to implement, allows rich data acquisition |
Google Sheets | Free | Data entry, aggregation, graph creation | Available for easy use, anyone can operate it |
Hotjar | Free/Paid | Heat maps, session recordings | Visualization of user behavior, free plan has functional limitations |
Simple Analytics | Free/Paid | Privacy-focused analysis | GDPR compliant, simple design |
Adobe Analytics | Free/Paid | Advanced analysis functions, real-time analysis | Best for large-scale data processing, requires expertise |
Mixpanel | Free/Paid | User behavior analysis | Detailed behavior analysis, setup can be complex, not available in Japanese |
Kissmetrics | Free/Paid | Customer behavior analysis, LTV enhancement | Effective marketing measures, requires expertise |
Amplitude | Free/Paid | User segmentation, mobile app analysis | Optimization of target measures, setup can be complex |
Cascade | Free/Paid | User-friendly UI from Japan, AI-powered advertising analysis, path conversion analysis, advertising material management | Increased efficiency, improved ROI on advertising costs, functionality completeness is an issue |
* Prices vary depending on the plan. Please check the official website of each tool.
Practice! Funnel Analysis Methods Using Various Tools
Funnel Analysis with GA4! In-Depth Analysis of Customer Behavior until Goal Achievement
Google Analytics 4 (GA4) is a powerful tool for analyzing website traffic and user behavior. Funnel analysis using GA4 allows you to visualize in detail the process from the moment customers access the website until they reach the final goal (e.g., purchase, inquiry), enabling you to understand dropout rates and conversion rates at each step. This helps identify areas for website improvement and optimize marketing measures.
How to Set Up GA4
To conduct funnel analysis in GA4, you first need to set your goals. A goal defines the actions you want to achieve on your website (e.g., visiting a specific page, submitting a specific form). Once goals are set, you will utilize the funnel exploration report. This feature visualizes the steps users take to achieve their goals. When creating the report, it is essential to accurately set the events or page views that represent each step.
Visualization and Analysis of the Funnel
In GA4's funnel exploration report, the number of users at each step, conversion rates, and dropout rates are displayed in graphs. This allows you to clearly understand at which step users are dropping off the most, identifying bottlenecks. Furthermore, by utilizing segment features, you can analyze behaviors of specific user groups (e.g., new users, repeat users) individually, enabling you to consider improvement measures tailored to your target demographic.
Identifying Improvement Points
From the results of funnel analysis, identify steps with high dropout rates and analyze their causes. For example, in the case of an e-commerce site, if there are many additions to the cart but few purchases, the design of the payment page or the complexity of the process may be to blame. Use GA4's event tracking features to analyze user behavior in detail and consider specific improvement measures. For instance, improvements to the page's UI/UX, reevaluation of pathways, and enhancement of promotions can be considered.
Simple Funnel Analysis with an Excel Template! Download and Use Immediately
If you cannot use tools like GA4 or want to perform simplified analyses, you can conveniently conduct funnel analysis by utilizing Excel templates. Various funnel analysis-related Excel templates are published on the internet. By using these templates, you can input data and automatically create visually clear funnel charts.
How to Use the Template
Many templates provide spaces for inputting the number of users or conversion counts at each step. Once the data is inputted, funnel charts will be created automatically. If necessary, adjust the chart’s color and title to make them visually clearer.
Understanding the Analysis Results
From the created funnel chart, check the number of users, conversion rates, and dropout rates at each step. Similar to GA4, identify steps with high dropout rates and analyze their causes. While it may be challenging to perform detailed analyses with Excel templates, it will help you grasp the overall picture and consider directions for improvement.
Applied Analysis
By utilizing Excel features, it is also possible to conduct more detailed analyses. For example, you can use pivot tables to analyze data from various perspectives (e.g., time of day, device, location). Additionally, by employing functions, you can automatically calculate conversion rates and dropout rates.
Automating Funnel Analysis with Python! Code Examples and Explanations
If you need more advanced analyses or automation, funnel analysis using programming languages like Python is effective. Python has numerous libraries convenient for data analysis, enabling efficient processing of large volumes of data and visualizing analysis results.
Necessary Libraries
To perform funnel analysis in Python, libraries like Pandas (for data manipulation), Matplotlib or Seaborn (for data visualization) are useful. These libraries can be easily installed using the pip command.
Code Explanation
Specific code examples vary depending on the data used and analysis methods. Generally, you would read, process data using Pandas, and create funnel charts using Matplotlib or Seaborn. Code examples will be omitted here as they exceed the scope of the article, but many tutorials are available online.
Execution Method and Interpretation of Results
When executing the Python script, analysis results including funnel charts will be output. From these results, check the number of users, conversion rates, dropout rates at each step and identify improvement points, just like with GA4 and Excel templates. Using Python enables automation of processing large data and complex analyses, achieving efficient funnel analysis.
Methods to Deepen Customer Understanding through Funnel Analysis【Case Studies】
Marketing Funnel Analysis: Optimizing the Customer Acquisition Process
Case Study 1: Funnel Analysis of an E-commerce Site
An e-commerce site conducted funnel analysis using Google Analytics. By analyzing dropout rates at each step from product view to adding to cart, and completing purchase, they discovered that the dropout rate after adding to cart was very high. Consequently, various measures were implemented such as redesigning the cart page, adding payment methods, and launching a free shipping campaign. As a result, the conversion rate after adding to cart improved by 15%, leading to increased sales.
Step | Dropout Rate (Before Improvement) | Dropout Rate (After Improvement) | Measures Taken |
|---|---|---|---|
Product View | 50% | 45% | High-quality product images, enhanced product descriptions |
Add to Cart | 30% | 15% | Redesign of cart page, addition of payment methods, free shipping campaign |
Purchase Completion | 10% | 8% | Simplification of payment process |
This case study demonstrates how funnel analysis can identify specific issues, allowing for effective improvement measures that lead to increased sales for an e-commerce site.
Case Study 2: Funnel Analysis of a BtoB SaaS Company
In BtoB SaaS companies, funnel analysis in lead nurturing becomes essential. By analyzing dropout rates at each step from inquiry to demo requests to contract conclusions, issues in lead nurturing can be identified. For instance, if the conversion rate after demo requests is low, there may be concerns regarding the content of the demo or the follow-up system.
A certain BtoB SaaS company utilized marketing automation tools like HubSpot to perform lead scoring and segmentation, implementing personalized email marketing to enhance the conversion rate after demo requests.
Step | Conversion Rate (Before Improvement) | Conversion Rate (After Improvement) | Measures Taken |
|---|---|---|---|
Inquiry | 50% | 55% | Simplification of inquiry form, reduction of response time |
Demo Request | 20% | 30% | Personalized email marketing, creation of demo videos |
Contract Conclusion | 10% | 15% | Review of contract terms, smooth contract procedures |
Sales Funnel Analysis: Discovering Bottlenecks to Improve Closing Rates
Case Study 3: Sales Funnel Analysis of a Real Estate Company
A real estate company can analyze the sales process from the first contact with customers to contract conclusion, allowing them to consider measures for improving closing rates. For example, if the dropout rate from property viewing reservations to contracts is high, there may be room for improvement in property explanations or proposals. Additionally, a lack of communication with customers can also lead to low closing rates.
Effective sales funnel analysis can accurately grasp customer needs and provide optimal proposals to aim for improved closing rates. By utilizing CRM systems, managing customer touchpoints appropriately allows for more effective sales activities.
Case Study 4: Sales Funnel Analysis of a Staffing Agency
A staffing agency can analyze the process from the first interview with job seekers to the acceptance of job offers to identify improvement measures that can lead to an increase in closing rates. For instance, if there are delays in communication after interviews or if proposals do not sufficiently consider the job seeker's desired conditions, it may lead to a decrease in acceptance rates.
Through regular funnel analysis, identifying and improving bottlenecks in the sales process can contribute to increased closing rates for staffing agencies. It also enhances job seeker satisfaction, thereby improving the company’s credibility.
Frequently Asked Questions about Funnel Analysis
What is Funnel Analysis?
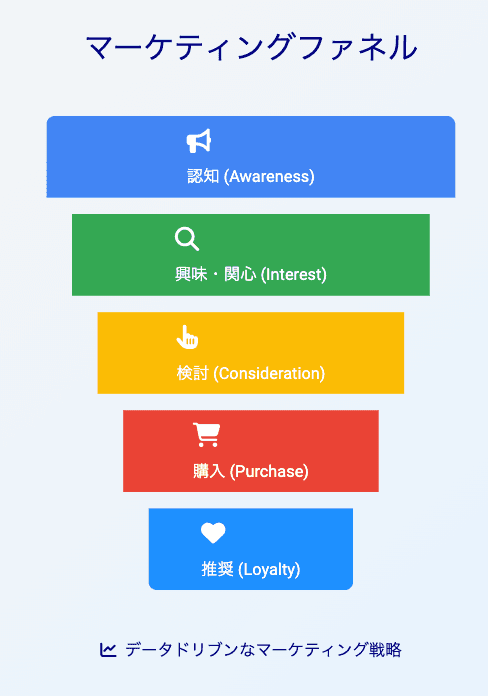
Funnel analysis is a method of visualizing the behavior process of customers until they reach the final goal (conversion), such as purchasing products or using services, in a diagram shaped like a funnel, analyzing dropout rates at each stage. By tracking customer behaviors step by step, it identifies at which stages many people are dropping off (bottleneck), aiming to improve conversion rates by implementing improvement measures. For instance, on a website, it analyzes dropout rates at each stage from access to inquiries, applications, and purchases.
What Types of Businesses Does it Work For?
Funnel analysis is effective for a variety of businesses, including both BtoB and BtoC. In particular, for companies utilizing websites, online services, and e-commerce sites, it is an extremely effective tool for analyzing customer online behavior and leading to improvements. It is also beneficial for improving the closing rates of potential customers in sales activities. For example, by analyzing each step from acquiring potential customers to business negotiations and contracts, it can identify and improve issues in the sales process. Additionally, it can be used to measure the effectiveness of marketing measures. For instance, analyzing the effectiveness of advertising campaigns clarifies which channels lead to conversions, allowing for more effective marketing strategies to be developed.
Which Tools are Recommended?
There is a wide range of tools available for funnel analysis, from free tools to paid ones with advanced functions. This article features a comparison table of four free tools and five paid tools, allowing for comparison of their functions, prices, and features. Which tool is optimum will depend on the scale of the business, analysis purposes, and budget. Free tools are recommended for those who want to start analyzing easily, while paid tools are suitable for those who want to achieve results with serious analysis. Our product, Cascade, is designed with a user-friendly UI for everyone and has sufficient functionality for practical use.
How Should I Utilize the Analysis Results?
The results of funnel analysis are an important source of information for improving a business. Specific improvement measures need to be introduced based on identified bottlenecks from the analysis results. For example, on a website, redesigning high-dropout pages, improving content, and reevaluating pathways may be considered. In sales activities, improving the communication methods with potential customers, reviewing proposal contents, and optimizing the sales process are options. The key is to build hypotheses based on data and continuously improve through validation such as A/B testing. Funnel analysis is not just data analysis; it is a crucial step to deepen customer understanding and contribute to business growth.
Conclusion: Make Data-Driven Decisions Through Funnel Analysis
This article comprehensively explained funnel analysis, a powerful method for increasing sales, covering tool selection, practical analysis methods, and specific case studies. By introducing various approaches including free tools, paid tools, analysis methods using GA4, Excel, and Python, we aimed to enable readers to choose the most suitable analytical methods according to their business size and skill level.
Funnel analysis enables the visualization of customer behavior and clarity of issues, facilitating the execution of effective marketing measures. By utilizing the tools and analysis techniques introduced in this article, identifying and improving the bottlenecks in your business will lead to an increase in conversion rates and ultimately boost sales. Particularly, analysis using GA4 is highly effective for conducting accurate analyses based on the latest data, leading to more refined improvement measures.
Data-driven decision-making is essential in modern business. Funnel analysis is a powerful weapon to support that decision-making. Please utilize the knowledge gained from this article to achieve strategic business development based on data analysis.
For more advanced funnel analysis and the establishment and implementation of efficient marketing strategies based on data, consider registering for the early access of Cascade. Cascade integrates advertising analysis and website behavior analysis, offering AI-driven advertising cost optimization, funnel analysis, and automated reporting.
Are you struggling with a lot of access to your website but not achieving significant results?
The key to visualizing the actions that customers take before purchasing products or applying for services, discovering and improving issues, is "funnel analysis." In 2024, data-driven marketing strategies are becoming increasingly important.
This article thoroughly explains everything from the basics of funnel analysis to practical applications. It includes a comparison of 10 recommended tools, both free and paid, specific analysis methods using GA4, Excel, and Python, as well as industry-specific success stories for e-commerce sites and BtoB SaaS companies, packed with practical know-how you can use starting tomorrow. Please master funnel analysis that leads to increased sales in this article.
Recommended 9 Funnel Analysis Tools! Comprehensive Comparison from Free to Paid
Funnel analysis tools are available with diverse functions and price ranges. Many people may find it difficult to choose which tool to select. Therefore, in this section, we have carefully selected four free tools and five paid tools, comparing their features, pros and cons to support your optimal tool selection.
3 Free Tools: For Those Who Want to Start Analyzing Easily
First, here are three recommended free tools for those who want to start funnel analysis without incurring costs. These tools come with basic functionalities and are attractive for their easy implementation. However, please note that there may be limitations on features and data capacity.
1. Google Analytics 4 (GA4)
GA4 is a free web analytics tool provided by Google. It allows you to analyze website traffic and user behavior in detail, and it can also be used for funnel analysis. By utilizing event tracking features, you can visualize customer behavior within the website, identify drop-off points, and explore improvement measures.
Features | Advantages | Disadvantages |
|---|---|---|
Rich data analysis capabilities, free | Easy to implement, allows diverse data acquisition, widely used on many websites resulting in abundant information | Advanced analysis requires expertise, data interpretation can take time |
2. Google Sheets
Google Sheets is a spreadsheet software that anyone can use easily. For simple funnel analysis, it can handle everything sufficiently just with the spreadsheet. By importing data from GA4 and creating graphs, you can visually understand the funnel.
Features | Advantages | Disadvantages |
|---|---|---|
Ease of use, free | Easy to implement, anyone can operate it, easy to visualize data | Lacks advanced analytical features, not suitable for large-scale data analysis |
3. Simple Analytics
Simple Analytics is a web analytics tool that emphasizes privacy. It anonymizes personal data during analysis, allowing compliance with privacy regulations like GDPR. The free plan has limits on the number of website registrations and data storage periods.
Features | Advantages | Disadvantages |
|---|---|---|
Privacy-focused, simple design | Analysis with a focus on privacy, simple interface | Functionality limitations in the free plan, restrictions on data storage, not available in Japanese |
5 Paid Tools: For Those Who Want Serious Analysis Results
If you need more advanced analysis or large-scale data processing, paid tools are recommended. Paid tools offer advanced features, customization, and comprehensive support, which are not available in free tools. Consider the cost-effectiveness and choose the appropriate tool.
1. Adobe Analytics
Adobe Analytics is the best tool for large-scale data analysis. It has various features such as advanced segmentation and real-time analysis capabilities. It is suitable for analyzing websites or apps of corporate scale.
Features | Advantages | Disadvantages |
|---|---|---|
Advanced analysis features, real-time analysis | Large-scale data processing, high customization | High price, requires expertise |
2. Mixpanel
Mixpanel is a tool specialized in user behavior analysis. It allows detailed tracking of user behavior within apps or websites, analyzing drop-off points and customer behavior patterns.
Features | Advantages | Disadvantages |
|---|---|---|
User behavior analysis, high customization | Detailed understanding of user behavior, effective improvement planning | High price, setup can be complex, not available in Japanese |
3. Kissmetrics
Kissmetrics is a tool that provides detailed tracking of customer behavior to enhance customer lifetime value (LTV). It is helpful for customer segmentation and personalization as well.
Features | Advantages | Disadvantages |
|---|---|---|
Customer behavior analysis, ability to analyze LTV enhancement | Deepening understanding of customers, executing effective marketing measures | High price, requires expertise |
4. Amplitude
Amplitude is a tool that can analyze user behavior for mobile apps and websites. By creating user segments and analyzing the behavior of each segment, you can consider optimal measures tailored to your target demographic.
Features | Advantages | Disadvantages |
|---|---|---|
User segmentation, mobile app analysis | Execution of measures tailored to the target demographic, effective improvement planning | High price, setup can be complex |
5. Cascade
Cascade is an AI-powered platform specialized in advertising analysis and website behavior analysis. It offers tools like advertising budget optimization, funnel analysis, and path analysis, maximizing advertising effectiveness and enabling data-driven decision-making.
Features | Advantages | Disadvantages |
|---|---|---|
AI analysis: Supports optimization of advertising costs, site improvement proposals, and automatic report creation. | Efficiency: Automates report creation and analysis work, significantly reducing time. | Just released, the completeness of features is an issue. |
Tool Comparison Table: Check Functions, Prices, and Features at a Glance
The table compares the 9 types of tools introduced above based on features, prices, and characteristics. Please use it as a reference for selecting the tool that best fits your needs.
Tool Name | Price | Main Functions | Features |
|---|---|---|---|
Google Analytics 4 (GA4) | Free | Website traffic analysis, user behavior analysis, funnel analysis | Easy to implement, allows rich data acquisition |
Google Sheets | Free | Data entry, aggregation, graph creation | Available for easy use, anyone can operate it |
Hotjar | Free/Paid | Heat maps, session recordings | Visualization of user behavior, free plan has functional limitations |
Simple Analytics | Free/Paid | Privacy-focused analysis | GDPR compliant, simple design |
Adobe Analytics | Free/Paid | Advanced analysis functions, real-time analysis | Best for large-scale data processing, requires expertise |
Mixpanel | Free/Paid | User behavior analysis | Detailed behavior analysis, setup can be complex, not available in Japanese |
Kissmetrics | Free/Paid | Customer behavior analysis, LTV enhancement | Effective marketing measures, requires expertise |
Amplitude | Free/Paid | User segmentation, mobile app analysis | Optimization of target measures, setup can be complex |
Cascade | Free/Paid | User-friendly UI from Japan, AI-powered advertising analysis, path conversion analysis, advertising material management | Increased efficiency, improved ROI on advertising costs, functionality completeness is an issue |
* Prices vary depending on the plan. Please check the official website of each tool.
Practice! Funnel Analysis Methods Using Various Tools
Funnel Analysis with GA4! In-Depth Analysis of Customer Behavior until Goal Achievement
Google Analytics 4 (GA4) is a powerful tool for analyzing website traffic and user behavior. Funnel analysis using GA4 allows you to visualize in detail the process from the moment customers access the website until they reach the final goal (e.g., purchase, inquiry), enabling you to understand dropout rates and conversion rates at each step. This helps identify areas for website improvement and optimize marketing measures.
How to Set Up GA4
To conduct funnel analysis in GA4, you first need to set your goals. A goal defines the actions you want to achieve on your website (e.g., visiting a specific page, submitting a specific form). Once goals are set, you will utilize the funnel exploration report. This feature visualizes the steps users take to achieve their goals. When creating the report, it is essential to accurately set the events or page views that represent each step.
Visualization and Analysis of the Funnel
In GA4's funnel exploration report, the number of users at each step, conversion rates, and dropout rates are displayed in graphs. This allows you to clearly understand at which step users are dropping off the most, identifying bottlenecks. Furthermore, by utilizing segment features, you can analyze behaviors of specific user groups (e.g., new users, repeat users) individually, enabling you to consider improvement measures tailored to your target demographic.
Identifying Improvement Points
From the results of funnel analysis, identify steps with high dropout rates and analyze their causes. For example, in the case of an e-commerce site, if there are many additions to the cart but few purchases, the design of the payment page or the complexity of the process may be to blame. Use GA4's event tracking features to analyze user behavior in detail and consider specific improvement measures. For instance, improvements to the page's UI/UX, reevaluation of pathways, and enhancement of promotions can be considered.
Simple Funnel Analysis with an Excel Template! Download and Use Immediately
If you cannot use tools like GA4 or want to perform simplified analyses, you can conveniently conduct funnel analysis by utilizing Excel templates. Various funnel analysis-related Excel templates are published on the internet. By using these templates, you can input data and automatically create visually clear funnel charts.
How to Use the Template
Many templates provide spaces for inputting the number of users or conversion counts at each step. Once the data is inputted, funnel charts will be created automatically. If necessary, adjust the chart’s color and title to make them visually clearer.
Understanding the Analysis Results
From the created funnel chart, check the number of users, conversion rates, and dropout rates at each step. Similar to GA4, identify steps with high dropout rates and analyze their causes. While it may be challenging to perform detailed analyses with Excel templates, it will help you grasp the overall picture and consider directions for improvement.
Applied Analysis
By utilizing Excel features, it is also possible to conduct more detailed analyses. For example, you can use pivot tables to analyze data from various perspectives (e.g., time of day, device, location). Additionally, by employing functions, you can automatically calculate conversion rates and dropout rates.
Automating Funnel Analysis with Python! Code Examples and Explanations
If you need more advanced analyses or automation, funnel analysis using programming languages like Python is effective. Python has numerous libraries convenient for data analysis, enabling efficient processing of large volumes of data and visualizing analysis results.
Necessary Libraries
To perform funnel analysis in Python, libraries like Pandas (for data manipulation), Matplotlib or Seaborn (for data visualization) are useful. These libraries can be easily installed using the pip command.
Code Explanation
Specific code examples vary depending on the data used and analysis methods. Generally, you would read, process data using Pandas, and create funnel charts using Matplotlib or Seaborn. Code examples will be omitted here as they exceed the scope of the article, but many tutorials are available online.
Execution Method and Interpretation of Results
When executing the Python script, analysis results including funnel charts will be output. From these results, check the number of users, conversion rates, dropout rates at each step and identify improvement points, just like with GA4 and Excel templates. Using Python enables automation of processing large data and complex analyses, achieving efficient funnel analysis.
Methods to Deepen Customer Understanding through Funnel Analysis【Case Studies】
Marketing Funnel Analysis: Optimizing the Customer Acquisition Process
Case Study 1: Funnel Analysis of an E-commerce Site
An e-commerce site conducted funnel analysis using Google Analytics. By analyzing dropout rates at each step from product view to adding to cart, and completing purchase, they discovered that the dropout rate after adding to cart was very high. Consequently, various measures were implemented such as redesigning the cart page, adding payment methods, and launching a free shipping campaign. As a result, the conversion rate after adding to cart improved by 15%, leading to increased sales.
Step | Dropout Rate (Before Improvement) | Dropout Rate (After Improvement) | Measures Taken |
|---|---|---|---|
Product View | 50% | 45% | High-quality product images, enhanced product descriptions |
Add to Cart | 30% | 15% | Redesign of cart page, addition of payment methods, free shipping campaign |
Purchase Completion | 10% | 8% | Simplification of payment process |
This case study demonstrates how funnel analysis can identify specific issues, allowing for effective improvement measures that lead to increased sales for an e-commerce site.
Case Study 2: Funnel Analysis of a BtoB SaaS Company
In BtoB SaaS companies, funnel analysis in lead nurturing becomes essential. By analyzing dropout rates at each step from inquiry to demo requests to contract conclusions, issues in lead nurturing can be identified. For instance, if the conversion rate after demo requests is low, there may be concerns regarding the content of the demo or the follow-up system.
A certain BtoB SaaS company utilized marketing automation tools like HubSpot to perform lead scoring and segmentation, implementing personalized email marketing to enhance the conversion rate after demo requests.
Step | Conversion Rate (Before Improvement) | Conversion Rate (After Improvement) | Measures Taken |
|---|---|---|---|
Inquiry | 50% | 55% | Simplification of inquiry form, reduction of response time |
Demo Request | 20% | 30% | Personalized email marketing, creation of demo videos |
Contract Conclusion | 10% | 15% | Review of contract terms, smooth contract procedures |
Sales Funnel Analysis: Discovering Bottlenecks to Improve Closing Rates
Case Study 3: Sales Funnel Analysis of a Real Estate Company
A real estate company can analyze the sales process from the first contact with customers to contract conclusion, allowing them to consider measures for improving closing rates. For example, if the dropout rate from property viewing reservations to contracts is high, there may be room for improvement in property explanations or proposals. Additionally, a lack of communication with customers can also lead to low closing rates.
Effective sales funnel analysis can accurately grasp customer needs and provide optimal proposals to aim for improved closing rates. By utilizing CRM systems, managing customer touchpoints appropriately allows for more effective sales activities.
Case Study 4: Sales Funnel Analysis of a Staffing Agency
A staffing agency can analyze the process from the first interview with job seekers to the acceptance of job offers to identify improvement measures that can lead to an increase in closing rates. For instance, if there are delays in communication after interviews or if proposals do not sufficiently consider the job seeker's desired conditions, it may lead to a decrease in acceptance rates.
Through regular funnel analysis, identifying and improving bottlenecks in the sales process can contribute to increased closing rates for staffing agencies. It also enhances job seeker satisfaction, thereby improving the company’s credibility.
Frequently Asked Questions about Funnel Analysis
What is Funnel Analysis?
Funnel analysis is a method of visualizing the behavior process of customers until they reach the final goal (conversion), such as purchasing products or using services, in a diagram shaped like a funnel, analyzing dropout rates at each stage. By tracking customer behaviors step by step, it identifies at which stages many people are dropping off (bottleneck), aiming to improve conversion rates by implementing improvement measures. For instance, on a website, it analyzes dropout rates at each stage from access to inquiries, applications, and purchases.
What Types of Businesses Does it Work For?
Funnel analysis is effective for a variety of businesses, including both BtoB and BtoC. In particular, for companies utilizing websites, online services, and e-commerce sites, it is an extremely effective tool for analyzing customer online behavior and leading to improvements. It is also beneficial for improving the closing rates of potential customers in sales activities. For example, by analyzing each step from acquiring potential customers to business negotiations and contracts, it can identify and improve issues in the sales process. Additionally, it can be used to measure the effectiveness of marketing measures. For instance, analyzing the effectiveness of advertising campaigns clarifies which channels lead to conversions, allowing for more effective marketing strategies to be developed.
Which Tools are Recommended?
There is a wide range of tools available for funnel analysis, from free tools to paid ones with advanced functions. This article features a comparison table of four free tools and five paid tools, allowing for comparison of their functions, prices, and features. Which tool is optimum will depend on the scale of the business, analysis purposes, and budget. Free tools are recommended for those who want to start analyzing easily, while paid tools are suitable for those who want to achieve results with serious analysis. Our product, Cascade, is designed with a user-friendly UI for everyone and has sufficient functionality for practical use.
How Should I Utilize the Analysis Results?
The results of funnel analysis are an important source of information for improving a business. Specific improvement measures need to be introduced based on identified bottlenecks from the analysis results. For example, on a website, redesigning high-dropout pages, improving content, and reevaluating pathways may be considered. In sales activities, improving the communication methods with potential customers, reviewing proposal contents, and optimizing the sales process are options. The key is to build hypotheses based on data and continuously improve through validation such as A/B testing. Funnel analysis is not just data analysis; it is a crucial step to deepen customer understanding and contribute to business growth.
Conclusion: Make Data-Driven Decisions Through Funnel Analysis
This article comprehensively explained funnel analysis, a powerful method for increasing sales, covering tool selection, practical analysis methods, and specific case studies. By introducing various approaches including free tools, paid tools, analysis methods using GA4, Excel, and Python, we aimed to enable readers to choose the most suitable analytical methods according to their business size and skill level.
Funnel analysis enables the visualization of customer behavior and clarity of issues, facilitating the execution of effective marketing measures. By utilizing the tools and analysis techniques introduced in this article, identifying and improving the bottlenecks in your business will lead to an increase in conversion rates and ultimately boost sales. Particularly, analysis using GA4 is highly effective for conducting accurate analyses based on the latest data, leading to more refined improvement measures.
Data-driven decision-making is essential in modern business. Funnel analysis is a powerful weapon to support that decision-making. Please utilize the knowledge gained from this article to achieve strategic business development based on data analysis.
For more advanced funnel analysis and the establishment and implementation of efficient marketing strategies based on data, consider registering for the early access of Cascade. Cascade integrates advertising analysis and website behavior analysis, offering AI-driven advertising cost optimization, funnel analysis, and automated reporting.
\FreeDownload Now/
\FreeDownload Now/
\FreeDownload Now/

Table of Contents

© 2025 Cascade Inc, All Rights Reserved.

© 2025 Cascade Inc, All Rights Reserved.
© 2025 Cascade Inc, All Rights Reserved.